
Niger J Paed 2014; 41 (4): 354 - 359
ORIGINAL
Yusuf T
CD4 + T-Lymphocyte
counts
Jiya NM
Ahmed H
among under-5 children with
protein-energy malnutrition as
seen in Usmanu Danfodiyo
University Teaching Hospital ,
Sokoto, Nigeria.
DOI:http://dx.doi.org/10.4314/njp.v41i4,13
Accepted: 28th July 2014
Abstract
Background: Protein-
highest value observed among
energy malnutrition is a prevalent
children
with
kwashiorkor
Yusuf T
(
)
public health problem in the de-
(2097.7±712.9 cells/µL) and low-
Jiya
NM, Ahmed H
est
value observed among those
Department of Paediatrics,
veloping countries. It affects body
Usmanu Danfodiyo University
systems including cell-mediated
with
marasmus
(1449.3±368.2
Teaching Hospital,
immunity.
cells/µL). There were significant
differences in the mean CD4 T-
+
PMB
2370, Sokoto, Nigeria
Objectives: To
determine the
ef-
fect
of
PEM
on
CD4
+
Email: dimeji74@gmail.com
T-
lymphocyte count of the control
lymphocyte counts among under -
(2314.3±491 cells/µL) when com-
5
children.
pared
to
those
of
marasmus
Methods: This
was a
prospective
(1449±368 cells/µL) (p= 0.001),
cross-sectional study conducted
marasmic-kwashiorkor (1888±762
among
HIV-negative
children
cells/µL) (p= 0.002), underweight
aged 6 - 59 months with PEM and
(1559±452 cells/µL) (p= 0.001)
the HIV-negative well-nourished
and
underweight-kwashiorkor
children between November 1 ,
st
(1534±402 cells/µL) (p= 0.001),
2010 and July 31 , 2011. The
st
but
it was comparable with that of
socio-demographic
characteris-
kwashiorkor
group
(2098±713
tics, weight and some haemato-
cells/µL) (p= 0.21). A statistically
logical indices of the both groups
significant
difference
was
ob-
served in the mean CD4
+
were documented. The CD4 T-
+
T-
lymphocyte count was determined
lymphocyte count of the different
using Partec cytoflow machine.
types of PEM with the highest
Result:
One-hundred
children
value observed among children
were
recruited for each group
with kwashiorkor (2097.7±712.9
over a 9 month period. The two
cells/µL) and lowest value ob-
study
groups were comparable in
served among those with maras-
age (p= 0.53) and sex (p= 0.65).
mus (1449.3±368.2 cells/µL).
The mean CD4 T-lymphocyte
+
Conclusion: The
PEM has
delete-
rious effects on the CD4
+
count in children with PEM was
T-
1705.5±605.6 cells/µL as com-
lymphocyte
counts among under-5
pared to 2314.3±491.1 cells/µL
children with PEM with the lowest
among the controls (p= 0.0001).
count observed among those pre-
A
statistically significant differ-
senting with marasmus.
ence was observed in the mean
Key words: CD4
T-Lymphocyte,
+
CD4 T-lymphocyte count of the
+
different types of PEM with the
Count, PEM, Under-5.
Introduction
includes a wide range of clinical stages, the extreme
forms being Marasmus and Kwashiorkor, while the mild
Protein-energy malnutrition (PEM) applies to a group of
and moderate forms express themselves as varying de-
pathological conditions arising from absolute or relative
grees of growth retardation. It is a complex situation as
lack of protein and/or calorie in varying proportions,
low intake of calories, protein and micronutrients;
occurring commonly in infants and young children . It
1
poverty, infectious diseases, poor breastfeeding and

355
weaning practices are implicated factors . However, in
1-3
in
these countries. The results of these studies are incon-
addition to these predisposing factors, kwashiorkor has
sistent. In some studies an increase of lymphocyte pro-
also
been ascribed to aflatoxins . Lack of food and clean
4
portion has been observed; while other studies show a
decrease in lymphocyte proportions.
10-14
water, poor sanitation, social unrest and political insta-
These inconsis-
bility lead to PEM. These factors are prevalent espe-
tent results may be probably due to difference in meth-
cially in sub-Saharan Africa; hence the persistence of
odology applied, types or severity of malnutrition stud-
the problem in the region .
5
ied, the variables compared or perhaps there were other
unknown factors that were not taken into consideration.
PEM is globally the most important risk factor for mor-
Hence, this study was carried out to determine the pat-
tern of CD4 T-lymphocyte count among the under-5
+
bidity and mortality, contributing to more than half of
deaths in children worldwide. PEM is responsible, di-
6
children with PEM.
rectly or indirectly, for 54% of the 10.8 million deaths
per year in children under five years of age. It also con-
tributes to every second death associated with infectious
diseases among children under five years of age in de-
Subjects and methods
veloping countries . In Nigeria, it is associated with
6,7
about 30-40% of deaths in preschool children. Children
8
The
study was a prospective cross-sectional in which
with severe PEM are at risk of several life-threatening
subjects were children with protein-energy malnutrition
problems like hypoglycaemia, hypothermia, serious in-
aged 6 months to 59 months and the controls were age
fections and severe electrolyte disturbances.
and gender matched well-nourished apparently healthy
children. The study was conducted between August, 1 ,
st
2010 and July, 31 , 2011 at the General Paediatric Out-
st
Adequate nutrition is essential for the maintenance and
integrity of the body systems and structures including
patient Clinic (GPOC), Immunization clinic, Emergency
body’s immunity. It has been shown that there is strong
Paediatric Unit (EPU), and Paediatric Medical Ward
association between PEM and infections. The interac-
(PMW) of Usmanu Danfodiyo University Teaching
tion of PEM and infection results in increase morbidity
Hospital (UDUTH), Sokoto, the Sokoto State capital.
and mortality among under-5 children in developing
countries. In the presence of PEM, ordinary childhood
The hospital is a tertiary health facility that serves as a
diseases result in severe consequences. These and simi-
referral centre for people of Sokoto, Zamfara, and Kebbi
lar observations suggest a defective immune response in
states; and the neighbouring Niger and Benin Republics
PEM. PEM is the single most common cause of immu-
in
the West African sub-region. Sokoto state is located
nosuppression or immunodeficiency in children .
7
at
the extreme part of North-western Nigeria between
longitude 3 and 7° East and between latitude 10 and 14
°
°
°
Severe PEM, particularly kwashiorkor, during childhood
North of the Equator. It shares borders with Niger
results in extensive atrophy of the thymus, spleen and
Republic to the north, Kebbi State to southwest and
Zamfara State to the east .
15
other lymphoid tissues. It has been related to changes in
9
cellular immunity, changes in peripheral lymphocyte
subsets (mainly cluster cells of differentiation (CD):
Approval was obtained from the Ethics Committee of
CD3 , CD4 , and CD8 ) and cytokines elaborated by
+
+
+
UDUTH, Sokoto, and written consent was also obtained
these cells. This immunodeficiency represents a key
from the parents/guardians of the patients. The age, sex,
factor in susceptibility to infections and has therefore
weight of the subjects and the controls; and the presence
been termed nutritionally acquired immunodeficiency
of
oedema in them were documented. The nutritional
syndrome (NAIDS).
7
status was classified using Modified Wellcome Classifi-
cation of PEM. Those with any form of allergic disor-
16
In
patients with severe PEM, both acquired immunity
der, haematological disorder and malignancies were
i.e., lymphocyte functions as well as innate host
excluded from the study.
defense mechanisms i.e., macrophages and granulocytes
are affected. Diminished immune functions render un-
Laboratory Methods
dernourished patients more susceptible to infections,
The CD4 T-lymphocyte count was determined using
+
which further worsen the nutritional status of the child,
energy loss, reduce productivity on the community
Partec cytoflow machine and HIV infection was con-
level, and perpetuate the alarming spiral of PEM, infec-
firmed with ELISA for children >18 months and HIV-
tion,
disease and poverty. This can only be interrupted
DNA
PCR for those aged ≤ 18 months.
by
prompt and adequate nutritional rehabilitation.
7,9
A
total of 5mls of whole blood was collected from each
of
patients into two ethylenediamine tetraacetate
With
the advent of the human immunodeficiency virus
(EDTA) vacuette containers, 2 mls in an EDTA vacuette
(HIV) pandemic, there has been a tendency to overlook
container for complete blood count and HIV tests at the
the role of malnutrition in immunodeficiency, and in-
Haematology laboratory and 3mls in the other container
for CD4 count using partec cytoflow machine which
+
deed, only a handful of studies have investigated the
CD4 T-lymphocyte subsets in children with PEM, espe-
+
was
done by the Investigator under the close supervision
cially in the developing countries despite the magnitude
of
the Laboratory Scientist in charge of the investiga-
tion. The sample collection and assay of CD4
+
of
the problem of malnutrition and infection especially
T-

356
lymphocyte count was done between 8am and 12mid-
Results
day
at the Immunology laboratory. The reagents and
protocol for CD4 T-lymphocyte count were obtained
+
One-hundred children were recruited each as subject
from Partec (Munster, Germany). A total of 20 µ L of
group and control group over a year period. The two
well-mixed whole blood in EDTA was placed in the test
study groups were comparable in age (p= 0.53), sex
tube provided, and 20 µ L of CD4-PE monoclonal anti-
(p=
0.65) as depicted in Table 1.
body was added. The contents of the tube was mixed
gently and incubated in the dark at room temperature for
15
min. Following incubation, 800 µ L of non-lyse buffer
Table 1: Some
demographic
characteristics of
the subjects
and
was added to the tube. The tube was mixed gently for 5
the
control
seconds to re-suspend the cells immediately before
Variable
PEM
Control
χ
2
t
p
counting. Calibration of the cytoflow instrument was
n=100
n=100
done with standard stained beads of known concentra-
Age (month)
tion to obtain the best peak and resolution for counting
Range
6.0
- 59.9
6.0
- 59.9
CD4 T cells.
+
Mean±S.D.
18.7±9.4
19.1±9.7
-
0.63
0.53
The complete blood count was analyzed at the haematol-
Gender
ogy laboratory using the Automated (Coulter) method
Female
36
(36%)
37(37%)
using Swelab Alfa 3-part haematology analyzer (Boule
Male
64
(64%)
63(63%)
0.20
-
0.65
Medical, Stockholm, Sweden, 2006). The 2ml of whole
blood collected earlier was mixed well using a mixer
The mean haematocrit value was significantly lower in
before analysis using the afore-mentioned machine fol-
children with PEM (29.4±3.4%) compared to the con-
lowing
the manufacturer’s instruction.
trols (34.0±1.9%) (t= -12.0, p= 0.0001). There were
significant differences in the haematocrit (F= 39.9, p=
Data Analysis
0.001), total leucocyte count (F= 8.5, p= 0.0001), abso-
lute neutrophil count (F= 4.3, p =
0.002) and absolute
The data entry and analysis were done using SPSS sta-
lymphocyte count (F=7.8, p= 0.0001) of the controls
tistical package version 17.0. The comparison of means
when compared with those of various clinical types of
was
done using Student’s t test. The comparison of pro-
PEM
as depicted in Table 2. The mean TLC and abso-
portions
of gender and socio-economic class of the mal-
lute
lymphocyte count were observed to be higher
nourished and well-nourished groups were done using
among children with kwashiorkor.
Chi-square test. A p value of 0.05 or less at 95% confi-
dence interval was regarded as statistically significant.
Table 2: Some
haematological parameters of
the children
with PEM
according to
clinical type
of PEM
and the
control
Parameters
Control
Mean±SD
values of
Complete
blood count
Marasmus
kwashiorkor
Underweight-
Underweight
Marasmic-
kwashiorkor
kwashiorkor
#
Haematocrit
34.0±1.8
28.6±2.4
28.9±1.7
31.8±3.7
29.2±4.3
28.3±3.3
ᶲ
TLC
*
7.2±1.6
9.2±1.4
7.1±1.2
8.7±2.2
8.6±1.4
8.5±1.9
±
*
ANC
2.3±0.8
2.7±0.8
2.5±0.7
3.0±1.5
2.9±0.9
2.9±1.0
†
ALC
*
4.2±1.1
5.6±1.5
3.9±0.7
4.9±1.3
4.9±0.9
5.1±1.2
‡
APC
*
285±72
253±73
249±70
295±81
270±87
200±61
Key: ANC=
Absolute Neutrophil
Count; ALC=
Absolute Lymphocyte
Count; APC=
Absolute Platelet
Count;
TLC= Total Leucocyte count; Kwash= Kwashiorkor; *figures are in 10
cells/L.
9
# =
(F=39.9,
p =
0.0001); ᶲ=
(F=8.5,
p =
0.0001); ±
= (F=4.3,
p =
0.002);
† =
(F=7.8;
p =
0.0001); ‡ =
(5.7,
p =
0.0001) (DELETE
as this
can go
for short
report moreso
it not
part of
your objective
for this
paper).
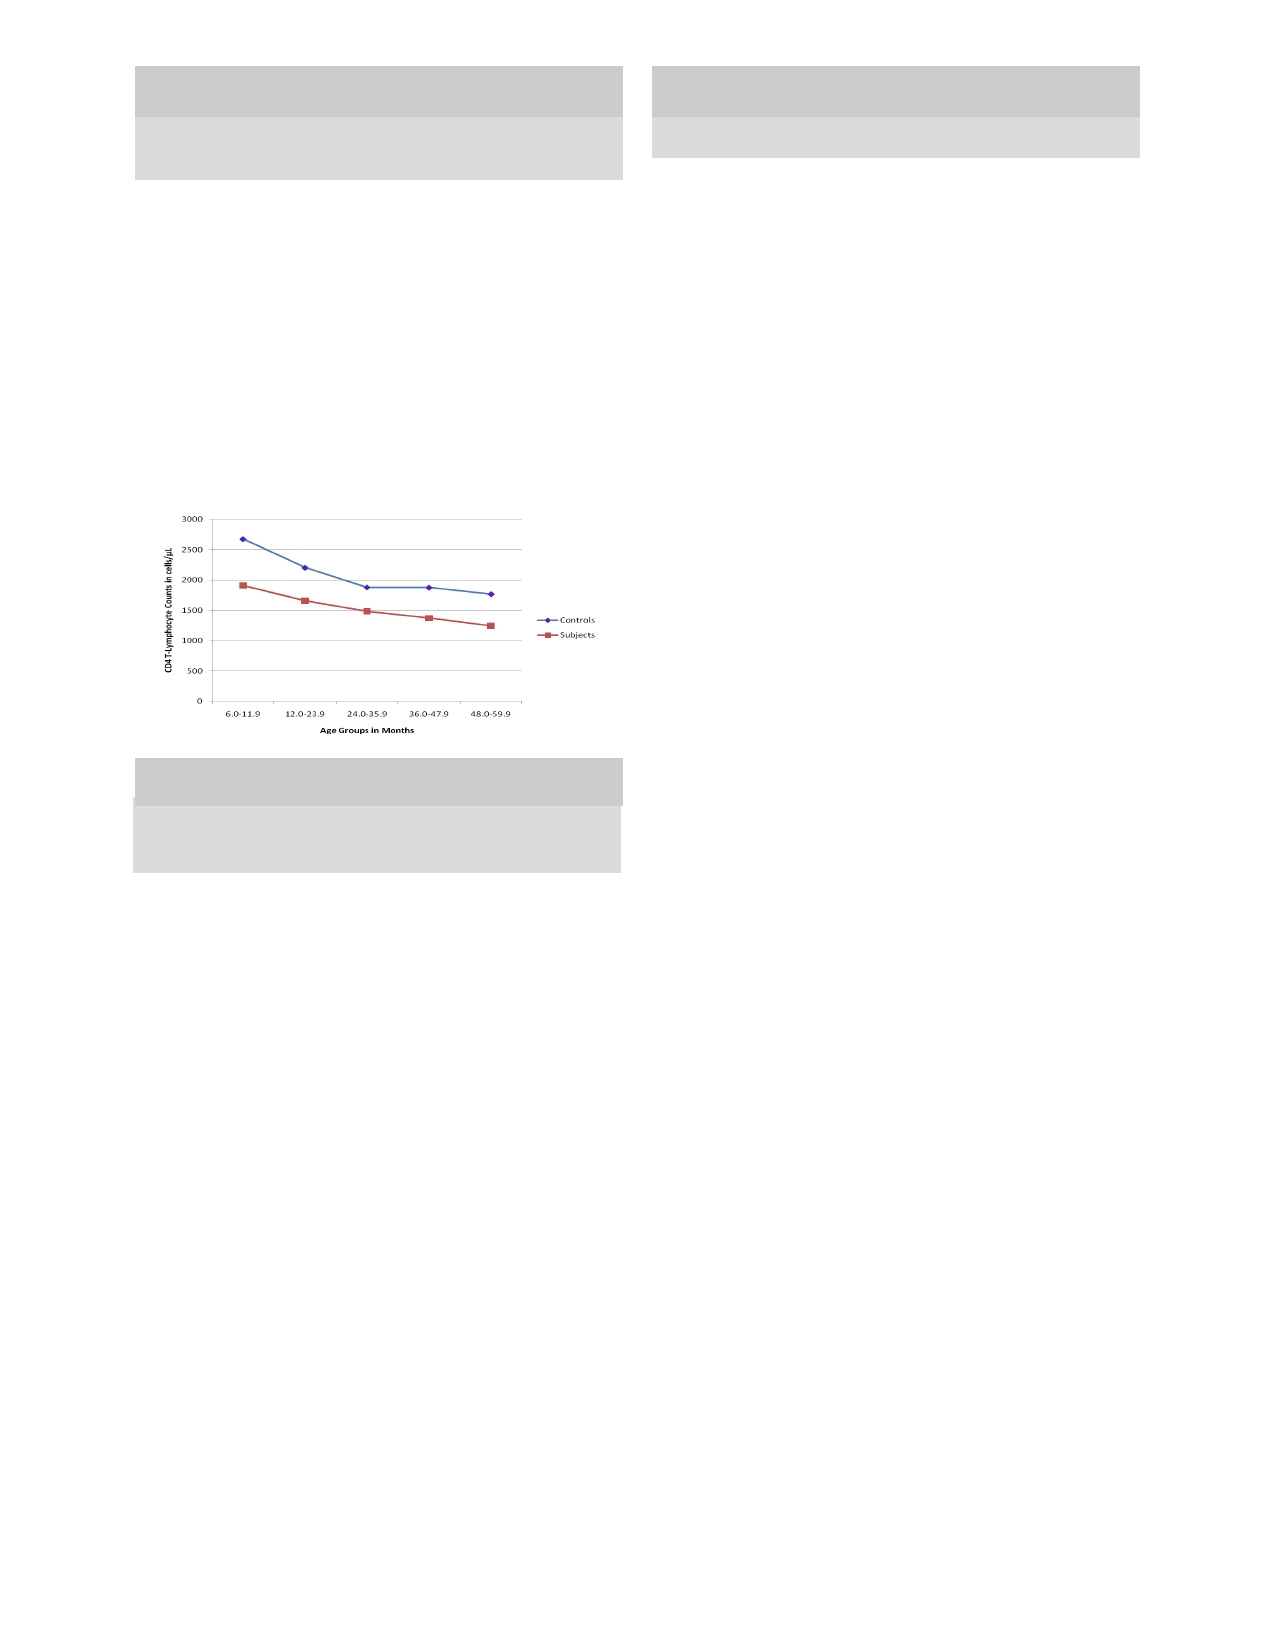
The mean absolute CD4 T-lymphocyte count in the
+
count (r= - 0.52, p = 0.0001) was also
observed in the
controls as shown in figure 1. The mean value of CD4
+
subjects was 1705.5 ± 605.6 cells/µL and the absolute
count ranges between 444 cells/µL and 3220 cells/µL in
T-lymphocyte count was comparable in both sexes
children with PEM as compared to 2,314.3±491.1 cells/
(female= 1692.2±605.9 cells/µL; male= 1712.4±609.9
µL
(range 1,434 cells/µL to 3,775 cells/µL) among the
cells/µL) (t=- 0.16, p =0.87) as shown
in Table 4. In both
groups, the mean CD4 T-lymphocyte percentage ranges
+
control group respectively. The difference in mean
CD4 T-lymphocyte count was statistically significant
+
between 49.1% and 51.4% across the age groups; and it
(t= -7.8, p = 0.0001). This significant
difference was
was 50.3% in both genders. There were no significant
differences in the mean CD4 T-cell percentage across
+
evident among children aged 36 months and below
when segregated by age group as shown in Table 3.
the age group (F= 0.28, p = 0.89) and
between the gender
(t=0.03, p =0.98) among the
malnourished. There were
no
significant differences in the mean CD4 T-cell per-
+
There was an inverse relationship between the age and
the mean CD4 T-lymphocyte count (r= - 0.2,
p = 0.04)
+
centage across the age group (F= 0.38,
p = 0.92) and
in
the children with PEM. A similar inverse relationship
between the gender (t=0.31, p =0.88)
among the controls.
between the age and the mean CD4 T-lymphocyte
+
357
Table 3: Comparison
of mean
of CD4
T-Lymphocyte counts
+
Table 5: The
mean value
of CD4+
T-Lymphocytes counts of
the
of
the Subjects and the Controls according to age group.
various types of PEM and the controls
Types of Mean±SD CD4 T-Lymphocytes Counts (cells/µL)
+
Mean±SD CD4 T-Lymphocyte Count (cells/µL)
+
PEM
6.0-11.9 mo
12.0-23.9 mo 24.0-35.9 mo
36.0-47.9 mo 48.0-59.9 mo Total
Age
Group
Subjects
Control
t
p
(month)
(n=100)
(n=100)
Control
n
32
56
8
2
2
100
2675.7±464.5 2204.7±414.7 1881.4±238.4
1877.0±60.8
1770.0±70.7 2314.3±491.1
-4.7
0.0001
*
6.0-11.9
909.9±672
2675.7±464.5
Kwashiorkor
n
4
14
2
-
-
20
n
32
32
2334±1064
2044±675
1995±219
-
-
2098±713
†
12.0-23.9
1657.8±594.0 2204.7±414.7
-3.8
0.0001
M-kwash.
n
9
10
1
-
-
20
n
53
56
2192±696
1649±792
1540
-
-
1888±762
‡
24.0-35.9
1484.3±351.8 1881.4±238.4
-4.6
0.003
U-Kwashiorkor
n
1
18
1
-
-
20
n
11
8
2440±0
1489±359
1428±0
-
-
1534±402
ᶲ
36.0-47.9
1374.0±132.9 1877±60.8
-
-
Underweight
n
4
6
6
2
2
20
n
2
2
2112±448
1583±424
1332±319
1374±133
1247±238
1559±452
±
48.0-59.9
1247.5±238.3 1770.0±70.7
-
-
Marasmus
n
14
5
1
-
-
20
n
2
2
1512±396
1288±296
1380±0
-
-
1449±368
Total
1705.5±605.6 2314.3±491.1
-7.8
0.0001
Fig 1: A
graph showing
mean absolute
CD4 T-lymphocyte
+
Keys: M-kwash= Marasmic-kwashiorkor, U-Kwashiorkor= Under-
count of the subjects and the controls according to age group
weight-kwashiorkor
* =
(t= 7.46, p = 0.21);†= (t= 3.20, p = 0.002); ‡= (t= 6.67,
p = 0.001);
ᶲ =
(t= 6.36, p = 0.001); ±= (t= 7.46, p = 0.001).
Discussion
Protein-energy malnutrition (PEM), especially severe
forms had been demonstrated to affect almost all body
systems as adequate nutrition is essential for the mainte-
nance and integrity of the body systems and structures
including body’s immunity.
3
The
mean absolute CD4 T-lymphocyte counts were
+
Table 4: The
levels of
CD4 T-Lymphocyte
Count in
children
+
with PEM according to age and sex.
shown to be significantly lower among children with
Gender
PEM in this series, and the difference was more obvious
Age
(months)
Male
Female
t
p
among children less than 3years of age. The comparable
n=64
n=36
mean
CD4
+
T-lymphocyte count between the two
6.0-11.9
Mean±SD
1829.1±663.8 2087.8±695.2
1.04
0.33
groups above 3 years of age was due to the small num-
Range
950-3118
1492-3220
ber of children recruited for the groups in these age
n
22
10
groups. This finding is comparable with the findings of
12.0-23.9
Mean±SD
1702.3±618.5 1571.4±543.4
-0.74
0.47
Yusuf et
al , Najera et
al
17
12
in
Mexico, Fakhir and col-
Range
978
- 3080
444
– 2900
leagues
13
in
India and Bachou
14
n
35
18
and coworkers in
24.0-35.9
Mean±SD
1643.5±646.5 1705.8±755.2
0.14
0.89
Uganda but in contrast to the findings of Rikimaru and
and Najera et
al who found no signifi-
19
his
colleagues
18
Range
1068-2150
1027-1774
n
5
4
cant difference in the levels of CD4 T-lymphocyte sub-
+
36.0-47.9
Mean±SD
1280.0±0.0
1468.0
-
-
n
1
1
set among the malnourished and well-nourished Ghana-
48.0-59.9
Mean±SD
1416±0.0
1079±0.0
-
-
ian and Mexican children respectively. This finding of
lowered CD4 T-lymphocyte count in children with
+
n
1
1
Total
Mean±SD
1712.4±609.9 1692.2±605.9
-
0.16
0.87
PEM
in this study may suggest depressed cellular medi-
A
statistically significant difference was observed in the
ated immunity, hence, poor immune response among
children with PEM as CD4 T-lymphocytes play a cen-
+
mean CD4 T-lymphocyte count of the different types of
+
PEM with the highest value observed among children
tral role in regulating the body immune system and re-
with kwashiorkor (2097.7±712.9 cells/µL) and lowest
sponse to antigen challenge such purified protein deriva-
tive and vaccination
20,21
value
observed
among
those
with
marasmus
.
Hence, these children may be
(1449.3±368.2 cells/µL). There were significant differ-
susceptible
to various forms of infections such as bacte-
ences
in the mean CD4 T-lymphocyte count of the con-
+
rial,
viral and fungal infections; and may have poor
trol (2314.3±491 cells/µL) when compared to those of
response to vaccination and antigen challenge tests such
marasmus (1449±368 cells/µL) (t= 7.46,
p = 0.001),
as
Mantoux test.
marasmic-kwashiorkor (1888±762 cells/µL) (t= 3.20,
p
In
this study the mean CD4 T-lymphocyte count was
+
=
0.002), underweight (1559±452 cells/µL) (t= 6.36,
p =
0.001) and underweight-kwashiorkor (1534±402 cells/
shown to be decreasing with increasing age in both the
µL)
(t= 6.67, p = 0.001), but it was
comparable with that
malnourished and well-nourished children with signifi-
cant negative correlation between the age and CD4 T-
+
of
kwashiorkor group (2098±713 cells/µL) (t= 7.46, p =
0.21) as shown in Table 5.
lymphocyte count. This finding is similar to the pattern
observed among the malnourished and well-nourished
healthy young children as reported in previous studies

358
The
absolute CD4 T-
+
both
in and outside Nigeria.
17,20-23
the
plasma cortisol to be maintained at sufficiently high
lymphocyte counts for age in this series was within nor-
level is responsible for the biochemical events in
mal
reference values reported among American
21
and
kwashiorkor. High levels of steroid in the body have
been
associated with low CD4 T-lymphocyte count,
+
Saudi Arabian children but were higher compared to
22
which may also explain the lower CD4 T-lymphocyte
+
the values reported by Emmanuel et al among healthy
20
counts among children with marasmus in this study.
3,29
Nigerian children in 2009 in Lagos. The difference may
be
related to the machine (FACScount machine) used in
This observation may suggest that a certain degree of
enumerating CD4 T-cells count in their study. The ma-
+
immunocompetence is required for the development of
chine could only determine count ≤ 2000 cells/µL
oedema in kwashiorkor.
(Partec cytoflow machine used in this study can detect
up
to 4,000 cells/µL) and perhaps the larger sample size
This implies that there is likelihood of immunosuppres-
in
Lagos series. The higher value of CD4 T-lymphocyte
+
sion in children with PEM especially those presenting
counts among infants compared to young children could
with marasmus. Severe PEM alters the immunological
be
related to the higher absolute lymphocyte count
competence of the body via a number of mechanisms
among this age group as a positive correlation has been
which include apoptosis of thymus gland, macro and
micronutrients deficiencies . The depletion of CD4 T-
1,3
+
established between absolute lymphocyte count and the
CD4 T-lymphocyte counts
+
24,25
.
This observation implies
lymphocytes count is associated with impaired cellular
that
interpretation of the CD4 T-lymphocyte counts in
+
immunity. As a result of this, children with PEM and
under-5 children has to be age-adjusted and indirectly
especially marasmus are likely to develop severe form
not reliable for monitoring of disease conditions such as
of
infection with resultant high morbidity and mortality
HIV infection.
rates among children with severe PEM. The higher
CD4
+
T-lymphocyte count observed among children
In
this series, the mean absolute CD4 T-lymphocyte
+
with kwashiorkor may not suggest immunocompetence
was similar in both males and females. A similar finding
in
this group of children as there may be other immu-
was reported by Yusuf T et
al
17
in
Sokoto, Nigeria and
nological derangements (which were not studied in this
Foca M and colleagues
26
in
USA, but in contrast to that
work) which make them susceptible to various forms of
reported by Mandala and coworkers
27
who reported sig-
infections and higher morbidity and mortality rates. Fur-
nificantly higher CD4 T-lymphocyte count among fe-
+
ther studies need to be conducted to further corroborate
males compared to the male Malawian children. This
these findings.
shows that gender has no significant effect on the CD4
+
T-lymphocyte count in children in our community.
Therefore, there is no need for different reference values
for
different gender in interpreting the CD4
+
T-
Conclusion
lymphocyte count in both genders.
The CD4 T-cell percentage was comparable in all age
+
In
conclusion, the PEM has deleterious effects on the
CD4 T-lymphocyte counts among under-5 children
+
groups below 5 years and between the genders as shown
in
this study. This is similar to earlier findings among
with PEM in our community, with the lowest count ob-
under-5 children both in and outside Nigeria.
20-23
This
served among those presenting with marasmus. These
implies that the CD4 T-cell percent is relatively stable
+
findings might reflect the effect(s) of PEM on the im-
with no significant change in children below 5years;
mune system. There is need for a large multi-centered
hence, it is very useful and reliable as a guide in treat-
study to be conducted to further elucidate immunologi-
ment decisions and monitoring of under-5 children with
cal derangements in children with PEM. Furthermore,
The CD4 T-lymphocyte percentage is relatively similar
+
HIV infection.
among under-5 irrespective of the age or gender, and
A
significant relationship between the levels of CD4 T-
+
therefore, can be useful in treatment decisions and moni-
lymphocyte count and the clinical types of PEM has
toring under-5 children with HIV infection. A large co-
been demonstrated in this study. The CD4 T-
+
hort
multicentre study would be needed to establish nor-
mal
reference values for CD4 T-lymphocyte subsets in
+
lymphocyte count is much lowered among children with
marasmus and highest among those with kwashiorkor
our community.
which appeared normal. A similar pattern was earlier
Bachou and his colleagues
14
reported by Yusuf et
al ,
17
and Stephen and his colleagues .
However, Rikimaru
28
Authors Contribution
and
his colleagues found no relationship between the
18
Yusuf T.: Source and analyzed the data, write up.
level of CD4 cells and the type of PEM. The observed
+
Jiya NM: Review of manuscript write up.
higher absolute CD4 T-lymphocytes among children
+
Ahmed H.: Conceptualized the research, review of the
with kwashiorkor may be related to the high absolute
manuscript and write up
lymphocyte count observed among children with
kwashiorkor in this study as there is positive correlation
Conflict of interest: None
between the total lymphocyte count and CD4
+
T-
Funding: None
lymphocyte count.
24,25
It
could also be related to the
blood level of cortisol in children with kwashiorkor, as it
was postulated in dysadaptation theory, that failure of

359
References
1.
Ulasi TO, Ebenebe J. Nutritional
12. Nájera
O, Gonzalez
C, Toledo
G,
22. Denny
T, Yogev
R, Gelman
R, et
Disorders in Childhood. In
et al .
Flow cytometry
study of
al., Lymphocyte subsets in healthy
Azubuike JC, Nkanginieme KEO:
lymphocyte subsets in malnour-
children during the first 5 years.
J
Paediatrics and Child Health in a
ished and well-nourished children
Ame Medic Assoc 1992; 11: 1484
Tropical Region: 2nd Edition.
with bacterial infections. Clin
–
8.
African Educational Services,
Diagn Lab Immunol. 2004;11: 577
23.
Shahabuddin S, Al-Ayed I. Age-
Owerri. 2007: 250 – 67.
–
80.
related Changes in Lymphocyte
2.
Heird WC: Food Insecurity, Hun-
13.
Fakhir S, Ahmad P, Faridi MA,
Subsets in Children:
ger
and Undernutrition. In Behr-
Rattan A. Cell-mediated immune
Clin Diagn Lab. Immun . 1998; 5:
man
RE, Kliegman RM, Jenson
responses in malnourished hosts.
J
632 – 5.
HB
(eds): Nelson’s Textbook of
Trop Paediatr . 1989; 4:175 – 8.
24.
Shearer WT, Rosenblatt HM, Gel-
Pediatrics: 17th Edition: WB
14.
Bachou H, Tylleskär T, Downing
man
RS, Oyomopito R, Plaeger S,
Saunders, Philadephia. 2004: 167-
R et
al . Severe malnutrition with
Stiehm ER Lymphocyte subsets in
73.
or
without HIV-1infection in hos-
healthy children from birth
3.
Reddy V. Protein-Energy Malnu-
pitalized children in Kampala,
through 18 years of age: the
trition. In Stanfield P. et al. Dis-
Uganda: differences in clinical
Pediatric AIDS Clinical Trials
eases of Children in the Subtropics
features, haematological findings
Group P1009 study. J
Allergy Clin
and
CD4 cell counts. Nutr
+
and
Tropics: 4th Edition.1991: 335
Immunol. 2003;112:973–980
-57.
J . 2006; 5:27.
25.
Mota I, “Tissue and cells of the
4.
Hendrickse RG, Coulter JBS,
15.
Sokoto State Business Directory.
immune system,” in Fundamentals
Lamplugh SM et al. Kwashiorkor
A
publication of the Commerce
of
Immunology, Bier DG and Dias
and
aflatoxins: a study in Suda-
Department, Ministry of Com-
da
Silva W, (eds.), Springer, Lon-
nese children. Br
Med J.1982;
merce, Industry and Tourism.
don, UK. 1986: 1 – 34.
285: 843 – 6.
Sokoto. 2007:14 – 18.
26.
Alavi SM,Ahmadi F, Farhadi M.
5.
Abdulaziz E. Protein-energy mal-
16.
Hendrickse RG. Protein-Energy
Correlation between total
nutrition. Available at: http://
Malnutrition. In Hendrickse RG,
lymphocyte count, haemoglobin,
haematocrit and CD4 count in
+
www.bibalex.org/supercourse/
Barr DGD and Mathews TS (eds):
Paediatrics in the Tropics.1 Edi-
st
supercourseppt/17011-
HIV/AIDS patients. Acta
Medica
18001/17671.ppt.
tion. Blackwell Scientific Publica-
Iranica . 2009; 1: 1 – 4.
6.
Lawoyin TO. Risk factors for
tion, London: 1991: 119-31.
27.
Foca M, Moye J, Chu C et al.
infant mortality in a rural African
17.
Yusuf T, Jiya NM, Ahmed H et al.
Gender Differences in
community. J.
Roy Soc
Health
The
pattern of CD4+ T-
Lymphocyte Populations, Plasma
2001; 121: 114 – 8.
Lymphocyte count in under-5
HIV
RNA levels and Disease
7.
Ulrich E.S. and Kaufmann S.H.:
children with protein energy mal-
Progression in a Cohort of
Malnutrition and Infection: Com-
nutrition with or without HIV
Children Born to Women Infected
plex Mechanisms and Global Im-
infection. Sahel
Med J.
2012; 2:57
with HIV. Pediatrics. 2006;118 –
pacts.
Published online May 2007.
- 63
46.
doi:10.1371/journal. pubmed.
18.
Rikimaru T, Taniguchi K, Yartey
28.
Mandala WL, MacLennan JM,
004115.
JE et
al . Humoral and cell-
Gondwe EN et al. Lymphocyte
8.
Sabitu K, Iliyasu Z, Hassan SS and
mediated immunity in
mal-
Subsets in Healthy Malawians:
Mande AT. Community level
nourished children in Ghana. Eur J
Implications for immunologic
nutrition information system for
Clin Nutr. 1998; 52: 344 – 50.
assessment of HIV infection in
action in rural communities. Ann
19.
Nájera O, González C, Toledo G,
Africa. J
Allergy Clin
Immunol.
Afr Med; 2004; 3: 120 – 5.
et al .
Early activation
of T,
B and
2010;1:203 – 8.
9.
Savino W. The Thymus gland is a
NK
lymphocytes in infected
29.
Stephen MH, Beatrice A, Mwiya
target in malnutrition. Eur
J Clin
malnourished and infected well-
M.
CD4 Counts Decline Despite
Nutr.2002; 56:46-9.
nourished children.
Nutritional Recovery in HIV-
10.
Chandra RK. Nutrition and immu-
J.Nutr.Immunol.2001;
Infected Zambian Children with
nology: from the clinic to cellular
5: 85-97.
Severe Malnutrition: Pediat-
biology and back again. Proc.
Nutr
20.
Emmanuel OI, Rosemary AA,
rics.2009;2: 347-51.
Soc.1999;58: 681 – 3.
Edna OI, et al. T-Lymphocyte
30.
Miyawaki T, Taga K, Nagaoki T,
11. Rodriguez
L, Gonzalez
C, Flores
Subsets in Apparently
et al .
Circadian changes
of T-
L, et
al . Assessment of Flow Cy-
21.
Healthy Nigerian Children”:Inter
lymphocyte subsets in human
tometry of Cytokine Production in
J Paediatr .
2010
peripheral blood. Clin
exp
Malnourished Children. Clin
Di-
Immunol . 1984; 55: 618 – 22.
agn Lab Immunol . 2005; 12: 502
–
7.